This Week’s Developments in the US Economy
On Cap Rates: Is This Time Different?
With the Fed cutting interest rates last month, the tightening interest rate regime that began over two years ago appears to be reversing course. This period of elevated rates—and to be clear, rates are still high—saw meaningfully higher costs of capital for borrowers of all types, and in private markets these costs have significantly constrained transaction activity and complicated price discovery across sectors.

In commercial real estate, this has contributed to a nationwide rise in capitalization rates (“cap rates”), and since Q2 2022 the average cap rate across all major property types has risen by over 120 basis points (and, in some sectors, much more than that). With interest rates expected to continue to decrease, we and other market participants anticipate a forthcoming compression in cap rates. The primary questions are how far and how quickly this will occur. History indicates a long and variable lag between the end of a rate hike cycle and meaningful cap rate compression; similarly, a pattern of lags has also occurred in cap rate expansions during periods of policy tightening. This time may be different, as we have seen a shorter lag in cap rate expansion compared to prior interest rate cycles, suggesting a higher market responsiveness and sensitivity to interest rate hikes.
Great Expectations: Implications of Correlation between Interest Rates and Cap Rates
While the average cap rate across all major property types has increased over the past two years, the extent of this rise has varied by sector. Between Q2 2022 and Q2 2024, cap rates in industrial, retail, and residential sectors rose by 98 bps, 236 bps, and 191 bps, respectively, according to the National Council of Real Estate Investment Fiduciaries (“NCREIF”, see accompanying visual).

However, according to an H1 cap rate survey conducted by the Global Commercial Real Estate Services (“CBRE”), fewer market observers anticipate a continued rise in cap rates over the next six months across the industrial, retail, and multifamily sectors than in the findings posted from their previous two survey publications. While these survey results align with the latest NCREIF cap rate figures, the pace and magnitude of compression remains to be seen.
Historic Trends in Cap Rate Compression
Examining interest rate cycles over the past two decades suggests that movements in cap rates tend to lag shifts in monetary policy. During the last two rate hike cycles preceding the Global Financial Crisis (“GFC”) and the recent pandemic, cap rates typically began to rise after the conclusion of the rate hike cycle and, on average, it has taken nearly six quarters for cap rates to start compressing after the initial rate cut following a period of elevated interest rates. Notably, this indicates a lag in both cap rate expansion and compression.
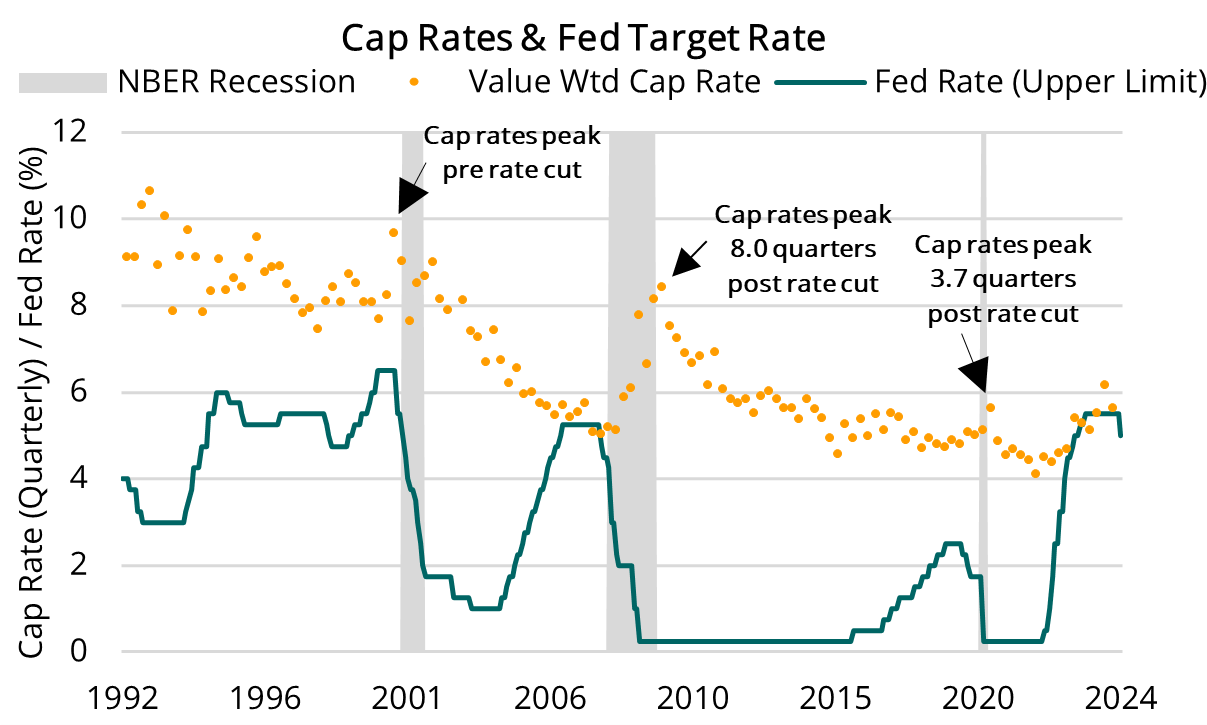
In contrast, the latest rate hike cycle, the steepest in over 40 years, saw a different pattern emerge. Given a limited amount of transaction data, cap rate figures started expanding in some sectors as early as late 2022, shortly after the initial rate hikes (see accompanying visual). The earlier onset of a cap rate increase may indicate a more responsive market—either due to the speed of market data or the relative impacts of higher rates on real assets or some combination of the two. While hindsight is 20/20, the potential for a quicker response to interest rates is plausible—that is, assuming that interest rates continue to decline as markets expect. Moreover, an earlier movement in cap rates is not unprecedented historically, as seen in the period leading up to the 2001 dot-com recession, where cap rates peaked in the quarter before the first rate cut and subsequently began to compress.
Ultimately the pace and magnitude of cap rate compression is a function of many factors, and we find that the data suggest a plausible case for cap rate compression in a lower interest rate environment.

